
Shopify now hosts more than 5.8 million live stores, which have generated $190.34 billion in profit in the last year. But not every store wins. Some brands scale fast and pull in huge numbers, while others struggle or close. The difference almost always comes down to strategy.
To make the right product decisions, you need to understand the trends behind the sales. When you know the patterns, the behavior, and the data that drive performance, it becomes easier to take actions that actually move your store forward.
This guide breaks down the latest Shopify sales statistics so you can see what works and what doesn’t. These numbers will help you spot opportunities, avoid common mistakes, and shape a strategy that’s backed by real data
How Many Stores Use Shopify
Shopify has become one of the world’s leading e-commerce platforms, powering millions of online stores.
Whether you’re a new merchant or an experienced seller, understanding the platform’s growth and usage can help you make informed decisions about your own Shopify store.
Total Active Stores
As of 2024, Shopify hosts over 5.8 million active stores globally. This represents an impressive scale, showing how widely Shopify is adopted across diverse industries and regions. Shopify’s growth has been consistent, with more stores launching every day.
Not all stores are verified, meaning some are active but not fully recognized through Shopify’s official metrics. It’s estimated that about 85-90% of stores are verified, with a smaller percentage falling into unverified categories.
Niche Distribution: Shopify hosts stores across various niches. The top categories include:
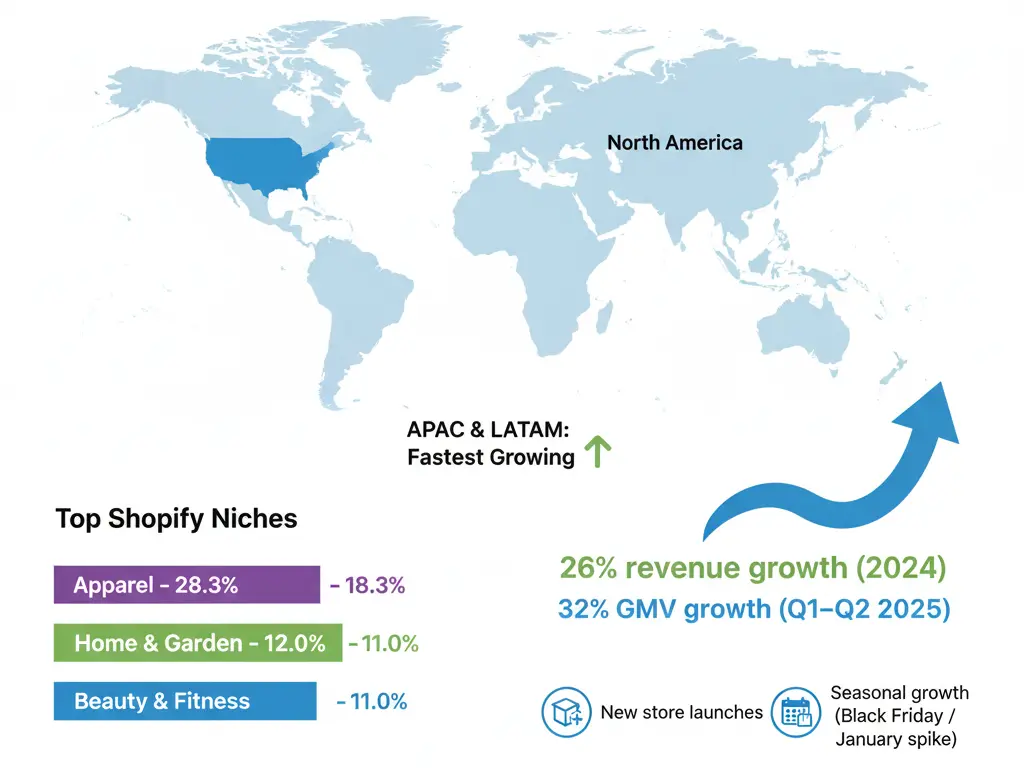
- Apparel: 28.3%
- Home & Garden: 12.0%
- Beauty & Fitness: 11.0%
These numbers reflect the most popular sectors for Shopify merchants, showing where most stores are focusing their products.
How Fast Shopify Is Growing
Shopify’s growth has been explosive over the years. The platform continues to expand rapidly, driven by global e-commerce trends and seasonal shopping events.
- Shopify has experienced double-digit growth year after year. In 2024, Shopify saw a 26% increase in total revenue, reaching around $8.9 billion. This reflects the expanding reach and increasing adoption of Shopify stores worldwide.
- Shopify also sees consistent growth each quarter. The Q1 and Q2 of 2025 show a 32% increase in GMV (Gross Merchandise Volume), demonstrating that the platform is scaling efficiently each quarter.
- Certain factors, like Black Friday/Cyber Monday (BFCM), have contributed to explosive growth periods for Shopify stores. Additionally, events like lockdown periods during the pandemic spurred e-commerce adoption, further accelerating Shopify’s growth.
New Stores Added Each Year
Shopify’s growth is fueled by the constant addition of new stores. In recent years, over 200,000 new stores have been added each month. This consistent influx demonstrates the accessibility and appeal of the platform.
- Shopify was founded in 2006, and since then, it has grown from a simple platform to a comprehensive e-commerce solution. By 2010, it was already powering over 100,000 stores, and it has grown exponentially since.
- In 2024, 2.8 million new stores were added to the platform globally, highlighting how fast Shopify is attracting new merchants.
- Shopify’s growth isn’t just concentrated in one area. While North America remains the largest region with over 2 million stores, APAC and LATAM regions have shown the most rapid growth in new stores, reflecting the global reach of Shopify.
- The months with the highest number of new store launches typically align with peak shopping seasons. For instance, November sees a surge due to the lead-up to Black Friday, and January sees significant store activity as entrepreneurs start new ventures in the new year.
Where Shopify Stores Are Located
Shopify is a global platform, and while certain regions dominate in store counts, emerging markets are catching up quickly.
The geographical distribution tells us not only where Shopify stores are thriving but also where growth is happening at a faster pace.
Stores by Country
If we’re talking about where Shopify stores are most concentrated, the United States dominates this category. It holds the largest number of Shopify stores by a massive margin. The gap between the US and every other country keeps widening each year.
This isn’t the case for smaller markets. Countries like the UK, Australia, and Germany contribute strong numbers, but they don’t come close to the volume seen in the US.
To make things clearer, here’s what the country-level numbers show based on the sources you provided:
- The United States hosts about 2.67 million Shopify stores, the highest in the world.
- The United Kingdom has around 210,000 stores, placing it firmly in second position.
- Together, the US and UK account for about 61.7% of all Shopify stores worldwide.
- Shopify merchants now operate in roughly 175 countries, showing how global the platform has become.
- Australia, Germany, and Brazil follow as the next biggest contributors in total store count.
Stores by Region
North America leads the shopify adoption by region easily. More than half of all Shopify merchants operate there, and the area continues to grow each year.
This isn’t the case for other regions. Europe has strong adoption, APAC is rising quickly, and LATAM is still developing but growing fast.
Here’s what the regional data shows:
- North America holds about 54% of all Shopify stores, the largest share globally.
- Updated 2025 numbers show North America with over 2.8 million stores, representing about 62% share.
- Europe accounts for around 664,800 stores, making it the second-largest region.
- APAC holds roughly 14% of all merchants, with faster-than-average year-to-year growth.
- LATAM remains small in total count but continues to expand, with around 5% global share.
Fastest-Growing Countries
Some countries are growing rapidly in their share of the shopify market. These countries might not have the highest total store counts, but they’re growing faster than mature markets.
Here’s what the growth data shows:
- India and France appear among the fastest-growing Shopify markets, based on new merchant adoption rates.
- APAC’s combined ecommerce market is projected to grow at around 18.5% CAGR, outpacing most global regions.
- APAC merchants generate about $699 million in annual revenue, driven by cross-border selling and mobile-first buying trends.
- North America remains the largest region, but its growth is slower than that of rising markets in APAC and Europe.
Local Buying Patterns
Shoppers behave differently on Shopify. Some people use shopify from mobile, while others tend to use it from the desktop. Users tend to spend more on the desktop version.
This isn’t the same across every region. Some countries lean heavily on mobile, while others still rely on desktop for higher-value purchases.
Here’s what the buyer-behavior data shows:
- Mobile drives about 79% of all Shopify traffic, but converts at only around 1.2%.
- Desktop converts better, with an average conversion rate of around 1.9%.
- Desktop shoppers spend about $95 per order, while mobile buyers spend around $38–$40 on average.
- In Spain’s 2024 BFCM season, stores saw a 52% sales jump and an AOV of €147.56, much higher than the global average.
- About one-third of Spanish orders were international, compared to a global cross-border average of 16%.
Shopify sales are not just about traffic. You need the right product pages, checkout flow, offers, SEO, ads, and conversion strategy working together.
We help Shopify stores increase sales by fixing weak points, improving customer experience, and building growth systems that turn visitors into paying customers.
What People Sell on Shopify
On Shopify, there are a lot of products that people sell, but among them, there are some popular types of products that pop up again and again. Fashion leads in raw store count, but beauty, home goods, electronics, and digital products claim big slices of the pie.
Here are the product types that dominate, that earth the most on what’s trending this year.
Most Common Product Types
If we look at sheer volume, fashion still sits at the top of Shopify. Apparel stores outnumber every other category, and most general stores still lean heavily into clothing.
This pattern does not mean other categories are small. Beauty, home goods, and electronics all show a strong presence, especially inside multi-category stores.
Here is what the category breakdown looks like in the latest datasets:
- Around 28.3% of all Shopify stores sell apparel, making fashion the largest single category on the platform.
- Home & garden accounts for about 12.0% of Shopify stores, putting it in second place worldwide.
- Beauty and fitness stores represent about 11.0% of the merchant base globally.
- Cross-industry overviews list fashion and apparel, beauty and skincare, home and garden, and electronics as the core top-selling ecommerce categories on Shopify.
Note: These shares come from technology-detection tools that classify stores by vertical. Some mixed or general stores may be grouped under a single primary category.
Best-Selling Niches
Fashion is still at the top of best-selling niches, but electronics, health, and home-related products often lead in revenue. This pattern looks similar in broader commerce stats inside shopify that helps validate the direction of data.
Here is what the revenue and growth story looks like:
- In global ecommerce, consumer electronics is currently the largest B2C segment by revenue, followed by fashion, furniture, toys, and hobbies. Shopify merchants ride those same demand waves.
- Shopify-focused niche roundups repeatedly rank fashion and apparel as the top-selling product category, with beauty, health and wellness, and home & kitchen close behind.
- Many advisory reports highlight health, wellness, and beauty as some of the fastest-growing Shopify niches.
Trending Items This Year
Trending shopify items are usually the everyday-use products that have a strong social appeal. This can be anything from shirts, skincare, wellness products, and home essentials.
Short-lived fads still appear, yet many of the top sellers are evergreen items that ride seasonal boosts instead of one-time spikes.
Here is what recent trend reports highlight:
- A 2025 Shopify report on US merchants lists shirts and tops as the bestselling products, with t-shirts leading within that group.
- The same article names skincare, makeup, vitamins and supplements, dresses, pants, and motor vehicle accessories among the most popular items sold by Shopify merchants.
- Broader ecommerce trend pieces call out phone accessories, home essentials, subscription food boxes, and beauty products as key growth categories in 2025.
Digital Product Sales
Digital products represent a serious revenue stream for online sellers. Creators and brands use shopify to sell digital products like ebooks, templates, courses, music, and more without touching physical stock.
This model differs from physical retail. Margins can be higher, delivery is instant, and scaling does not depend on warehouses or shipping networks.
Here is what the digital product landscape looks like:
- Shopify reports that digital products generated more than $124 billion globally in 2025, across formats like ebooks, videos, courses, music, and templates.
- Common digital product types include ebooks, online courses, video lessons, audio files, design templates, software, and memberships, often paired with physical products.
- Third-party digital commerce reports highlight templates and online courses as especially in demand, because they solve concrete problems and carry high perceived value.
Subscription Product Growth
Subscription products use the recurring commission model. That’s why the sellers get a stable monthly income. The shoppers increasingly accept subscription boxes, refills, and access-based offers.
This model behaves differently from one-off sales. Retention, churn, and lifetime value matter more than raw order counts.
Here is what current data and platform metrics suggest:
- In 2023, Shopify’s own subscription solutions revenue reached about $1.84 billion, around 26% of total company revenue.
- By Q2 2025, subscription solutions contributed roughly 24% of overall revenue, with $656 million in subscription revenue for that quarter alone, up from $563 million a year earlier.
- Outside of Shopify, consumer research shows that the average person now manages around 12 active subscriptions and spends more than $273 per month on recurring services.
- Industry breakdowns highlight consumables (food, coffee, supplements), beauty, pet products, and digital content memberships as some of the strongest subscription niches.
How Much Money Shopify Stores Make
Every Shopify store owner wonders how much money the average store makes. The reality is that revenue can vary greatly. Some stores bring in massive earnings, while many others operate at a much smaller scale.
Understanding the average store revenue, revenue patterns, and growth trends can help make informed decisions for your own store.
Average Store Revenue
While it’s hard to pinpoint exactly what a “normal” Shopify store makes, due to the wide range of outcomes. The average Shopify store generates about $67,000 in yearly revenue, or roughly $5,583 per month.
However, these averages can be misleading because they are often skewed by top-performing stores.
- Profit Margins: On average, Shopify stores see a 10% profit margin, with top performers reaching 20%, and less successful stores closer to 5%.
- Revenue Distribution: The top 1% of Shopify stores account for about 80% of total platform revenue. It highlights the significant disparity between high-performing and average stores.
- Platform GMV: Shopify stores together processed about $292.3 billion in GMV (Gross Merchandise Volume) in 2024. This underscores the enormous potential for success on Shopify, but also reflects the wide spread between the top and bottom performers.
Revenue by Store Size
Shopify is home to businesses of all sizes, and revenue varies significantly depending on the scale of the store.
- Small Businesses: About 66% of Shopify stores fall under the small business category, typically generating less than $50 million per year.
- Mid-Size Businesses: Around 17% are mid-sized businesses, and about 9% are enterprise-level stores, often with $1 billion+ in revenue.
- Enterprise Businesses: Shopify Plus, designed for larger brands, typically caters to merchants with revenue ranging from $1 million to $500 million per year.
These figures show how revenue is concentrated among larger brands, but the vast majority of Shopify merchants are small businesses with more modest revenue.
Revenue by Niche
Not all niches on Shopify earn the same amount. Some categories see higher average order values (AOV) and more repeat purchases, which boost total revenue.
Top Revenue Niches:
- Electronics and Fashion are two of the highest-revenue-generating categories on Shopify, with cosmetics also ranking highly.
- Apparel is the most common category by store count, with over 500,000 to 540,000 apparel stores, followed by home & garden stores.
Revenue Competition: While apparel dominates in store numbers, it also faces significant revenue competition due to the large number of stores in the category.
Revenue Growth Patterns
Revenue growth on Shopify is far from linear. Many stores experience steady growth, while others see massive spikes during key shopping events.
- Shopify’s GMV grew from $61.14 billion in 2019 to $235.91 billion in 2023, more than tripling in just four years.
- GMV climbed again to about $292.3 billion in 2024, showing that the growth trajectory continues upward.
- Shopify Plus merchants, like a skincare brand, have experienced significant revenue boosts. One case study showed the brand scaling from €3 million to €5 million in a single year after migrating to Shopify Plus.
Repeat Customer Revenue
Getting repeat customers is key to growing a stable revenue stream. While acquiring new customers can be expensive, repeat buyers often generate more revenue at a lower cost.
- One dataset finds that about 28.2% of Shopify customers return to make another purchase, on average.
- Another analysis reports an average returning customer rate of around 27%, lining up closely with the Uptek number.
Monthly vs Yearly Revenue Behavior
Revenue patterns on Shopify are seasonal, with peaks during major shopping events like Black Friday and Cyber Monday (BFCM).
- During the 2024 Black Friday-Cyber Monday weekend, Shopify merchants generated about $11.5 billion in sales. The biggest seasonal weekend on record.
- One breakdown shows Shopify brands accounting for more than 12% of the total US ecommerce market share during Cyber Week 2024, with $9.3 billion in sales and 875 million shoppers touched.
- Another BFCM report notes sales peaking at around $4.6 million per minute, with an average cart value of $108.56 and 16% of orders crossing borders.
These patterns suggest that while Shopify stores can experience high sales during certain events, they need to plan for quieter months as well.
Shopify’s Own Financial Growth
As Shopify continues to evolve, it has transitioned from a small startup to a massive e-commerce platform with billions in revenue.
The platform now generates significant income from both subscriptions and merchant fees, reflecting its role as a major player in the e-commerce space.
Total Platform Revenue
Shopify has shown impressive growth in its revenue, with steady increases each year:
- 2023: Shopify’s total revenue reached $7.1 billion, a 26% increase from 2022 (source: Shopify Investors).
- 2024: Revenue climbed to about $8.9 billion, continuing the 26% year-over-year growth.
- 2025: Trailing twelve-month revenue is projected to be between €9.2–9.6 billion based on recent estimates .
Two main revenue streams drive Shopify’s success:
- Subscription Solutions (plan fees and related products) – This contributed 26% of total revenue in 2024 .
- Merchant Solutions (payments, transaction fees, value-added services) – This makes up 74% of total revenue.
Recent data shows Shopify’s profitability is also on the rise, with double-digit free cash flow margins over the last eight quarters.
GMV (Gross Merchandise Volume)
GMV represents the total value of all orders processed through Shopify stores, providing a clear view of the volume of transactions on the platform.
Here’s how GMV has evolved over the past few years:
- 2019: $61.1 billion
- 2020: $119.6 billion
- 2021: $175.4 billion
- 2022: $197.3 billion
- 2023: $235.9 billion
- 2024: $292.3 billion, representing a 24% year-over-year increase.
The growth of GMV is driven by:
- More active stores: Shopify continues to attract new merchants.
- Higher average order values (AOV): Consumers are spending more per transaction.
- Deeper use of Shopify Payments and Shop Pay: These tools make transactions smoother, encouraging more sales.
Subscription Revenue
Shopify’s Subscription Solutions provide a steady base of income, with a relatively consistent share of total revenue over the years.
- 2023: Subscription revenue was around $1.8 billion, accounting for 26% of total revenue.
- 2024: This stayed the same at 26% of total revenue, totaling about $2.3 billion.
- 2025: Projections for Q2 show $656-$620 million in Subscription revenue, with an annual growth rate of 17-21% .
While Merchant Solutions (transactions and payment processing) outpace subscriptions in terms of revenue growth, subscription income remains a steady foundation for Shopify’s financial model.
Merchant Solution Revenue
The largest chunk of Shopify’s revenue comes from Merchant Solutions. These services are tied directly to the sales volume of Shopify merchants, making them a crucial revenue stream.
- 2023: Merchant Solutions generated about $5.2 billion, or 74% of Shopify’s total revenue.
- 2024: This grew to $6.6 billion, representing a 20% year-over-year growth.
- 2025: The Q2 data shows $2.02 billion, up 37% from the previous year.
As merchants sell more and use tools like Shopify Payments and Shop Pay, Shopify earns a larger share from each transaction.
Year-Over-Year Growth
Shopify has experienced consistent, double-digit growth across both revenue and GMV. This growth is primarily driven by new merchants joining the platform and existing stores increasing their sales volume.
- 2023: Revenue grew 26% year-over-year, from $7.1 billion to $8.9 billion.
- 2024: GMV reached $292.3 billion, marking a 24% year-over-year increase.
- 2025: Q1 and Q2 revenue continued to show growth, with high-20s to low-30s percent increases in both revenue and GMV.
These numbers reflect the strong upward momentum Shopify continues to build in the e-commerce market.
Where Shopify Earns the Most
Shopify generates the bulk of its revenue through Merchant Solutions. The more merchants sell, the more Shopify earns in transaction fees, payments, and related services.
- 2024: Subscription Solutions made up 26% of total revenue, while Merchant Solutions contributed 74%.
- Q2 2025: Of the $2.68 billion in total revenue, $2.02 billion came from Merchant Solutions, while $656 million came from Subscription Solutions.
International markets are contributing more to Shopify’s growth, with 33% revenue growth outside North America, surpassing North America’s 23% growth in 2024.
How Shoppers Behave on Shopify Stores
Understanding how visitors act on Shopify stores can help you fix drop-off zones, improve trust, and boost conversions.
Let’s explore what typical shopper behaviour looks like, and what it implies for store owners.
First-Time vs Repeat Shoppers
For many stores, the biggest growth lever isn’t just new customers but getting old ones to come back. According to one Shopify analysis, repeat customers often drive a large share of future revenue.
Here are key findings:
- Around 28.2% of customers on Shopify stores return to make another purchase.
- One Shopify case study shows repeat customers generated 44% of orders and 46% of revenue, despite being only 21% of the customer base.
- Because first-time visitors are more numerous, many store owners focus on acquisition. But repeat buyers cost less to convert and often spend more.
Why Shoppers Leave Without Buying
If a visitor leaves without buying, it often boils down to friction, hidden costs, or trust issues. Shopify’s published data and industry benchmarking highlight the top causes.
Here are some core reasons:
- Extra costs such as shipping, taxes and fees cause abandonment in about 48% of cases.
- Mandatory account creation blocks roughly 26% of shoppers from proceeding.
- Credit card or payment security concerns stop about 25% of users.
- Additional friction comes from slow delivery, complex checkouts and limited payment options.
Add-to-Cart Behavior
Adding to cart is a strong indicator of intent – but many never get past that step. On Shopify stores, you’ll find large numbers of carts created without purchases being completed.
Key findings:
Checkout Behavior
Checkout is the final step before conversion and also where many shoppers exit. Reducing friction here has one of the highest ROI impacts.
Highlights include:
- One industry overview reports that 22% of shoppers abandon during checkout because of complexity, despite having intent to purchase.
- Shopify notes that using faster checkout flows like Shop Pay can boost conversion up to 50% higher than a guest checkout.
- Transparent pricing, fewer steps and multiple payment options are key to reducing checkout drop-off.
Average Session Length
How much time a shopper spends on your store gives clues about intent, engagement and conversion readiness.
Current benchmarks suggest:
What Makes Shoppers Trust a Store
Trust is the invisible foundation of online shopping. Without it, shoppers hesitate – and many never complete the purchase.
Here are signs and trust levers that top Shopify stores use:
- Displaying recognizable payment logos, security badges and SSL certificates reduces abandonment due to 25% payment/security concerns.
- Clear shipping, returns and cost information offset the ~48% abandonment rate caused by hidden extra costs.
- One-click/fast checkout (like Shop Pay) signals modern UX and reliability.
- Authentic customer reviews, visual UGC, and social proof make new visitors feel safe.
- Quick, transparent customer support (live chat, help docs, FAQs) reduces hesitation.
How Shopify Stores Get Traffic
Driving traffic to your Shopify store is key to generating sales. There are several ways shoppers find their way to Shopify stores, including organic search, paid ads, social media, and more.
Organic Search
Organic search remains one of the most important sources of traffic for Shopify stores. Unlike paid ads, shopify SEO builds over time and typically brings in visitors with higher intent to purchase.
Data Highlights:
- 13.8% of Shopify store traffic comes from organic search (source: Uptek).
- Across all websites, about 33% of traffic comes from organic search .
- Stores that invest in SEO see better long-term results, lower cost per visit, and higher lifetime value per visitor.
Paid Ads
Paid ads are great for driving immediate traffic, but the ads come at a cost and the cost of paid ads can vary. While they can be effective for new product launches or scaling, paid traffic often has a lower conversion rate compared to organic.
What the Data Shows:
- Paid advertising is a significant but smaller share of traffic for Shopify stores.
- Paid search and display ads often cost more per click and convert lower than organic search in many cases.
- Shopify brands use paid ads primarily for new product launches, retargeting, and scaling once organic traffic is established.
Social Media Traffic
Social media platforms are becoming an increasingly important source of traffic, especially for product discovery. While it may not yet dominate, social media is growing fast and offers a unique opportunity to engage with potential customers.
Data Highlights:
- For Shopify stores, social media referral traffic contributes about 1.8% (source: Uptek).
- Successful Shopify brands report higher engagement from social traffic, particularly when using influencers or direct product posts.
- Social platforms like Instagram and TikTok are now heavily integrated with e-commerce, making them more valuable for product discovery.
Referral Traffic
Referral traffic comes from links or mentions on third-party sites, affiliates, or external content. This is an often underutilized channel that can provide high-quality visits without the cost of ads.
What the Data Shows:
- Around 25.6% of Shopify traffic comes from referrals and organic search combined.
- Many Shopify merchants report that affiliate links and influencer collaborations drive meaningful visits without the cost of paid ads.
Direct Traffic
Direct traffic refers to visitors who come to your store by typing in the URL, using a bookmark, or returning to the site. This traffic typically represents loyal visitors or people who are already familiar with your brand.
What the Data Shows:
- About 71% of Shopify traffic comes from direct visits.
- This suggests that many stores have loyal visitors who return regularly, or that traffic is misattributed (e.g., visitors from ads that are not tracked properly).
Traffic by Niche
Traffic sources can vary greatly depending on your store’s niche. Some niches, like fashion, may see more social traffic, while others, like electronics, rely heavily on organic search.
Key Insights:
- Fashion & apparel, home & garden, and beauty & fitness are among the largest niches by store count.
- Niche categories like beauty & wellness often see strong social media traffic, while electronics and home goods tend to perform better with organic search and comparison traffic.
Traffic by Region
The region your store is in can have a significant impact on which traffic channels work best. For example, mobile-first regions like APAC have different traffic behavior than North America or Europe.
What the Data Shows:
- Asia-Pacific (APAC) is expected to be the fastest-growing region for Shopify due to increased mobile commerce and internet penetration.
- In 2024/2025, 49.2 million visits came from the U.S., and 20.8 million from India, showing where the largest traffic volumes are coming from.
Conversion Rates on Shopify
Conversion rate refers to the percentage of visitors who make a purchase after visiting a store. On Shopify, these rates vary widely depending on the store, niche, traffic source, and device.
Let’s break down the numbers and see where Shopify stores generally land.
Average Shopify Conversion Rate
Shopify stores typically have a conversion rate between 1.3% and 2%. However, this figure can vary depending on the store’s focus, with some outperforming and others underperforming.
It’s important to note that new stores and low-ticket items tend to have lower conversion rates. More established brands or high-ticket niches tend to perform better.
Here’s what the data shows:
- The average Shopify conversion rate sits between 1.3% and 2%.
- Stores performing well hit 2.5% to 3.3%, which puts them in the top quartile.
- The top 10% of Shopify stores convert at over 4.5%.
Conversion by Niche
Certain niches on Shopify tend to have higher conversion rates due to customer trust, purchasing habits, or product characteristics.
Here’s how conversion rates generally break down by niche:
- Beauty & cosmetics convert around 2.3% to 3%, thanks to strong impulse buying.
- Home & garden sits around 1.7% to 2.4%.
- Fashion performs lower, averaging 1.2% to 1.7%, mainly due to sizing hesitation and returns.
- Electronics often convert near 1%, since buyers compare prices heavily.
Conversion by Device
Device choice plays a significant role in conversion rates. While mobile devices drive most of the traffic, desktop users tend to convert at a higher rate.
Here’s the breakdown:
- Desktop converts around 1.9% on average.
- Mobile converts around 1.2%, even though it delivers 70–80% of traffic.
- Tablet users sit in the middle with 1.5% average conversion.
Conversion by Traffic Source
The source of traffic to your store plays a huge role in conversion rates. Direct traffic from loyal visitors generally converts best, while other channels like paid ads and social media bring traffic with lower buying intent.
Here’s the pattern:
- Direct traffic converts the highest, usually 2.5% to 3.4%.
- Email traffic performs almost as well, averaging 2% to 3%.
- Organic search lands around 1.7% to 2.1%, depending on niche.
- Paid ads convert lower at 0.7% to 1.3% for cold audiences.
- Social traffic often converts the lowest at 0.5% to 0.8%.
What Boosts Conversion
If we’re talking about easy wins, three conversion boosters stand out across Shopify stores:
- Fast checkout tools like Shop Pay, which can lift conversion by up to 50%.
- Clear shipping details, since hidden fees cause nearly 48% of abandoned carts.
- High-trust product pages with reviews, photos, and social proof.
Other proven boosters include better product descriptions, better returns policies, and multiple payment options.
Shopify Marketing Performance
Effective marketing is key to driving traffic and sales on Shopify. Whether you’re leveraging SEO, email marketing, or paid ads, each channel plays a distinct role in helping you grow your store.
Here’s a breakdown of Shopify’s marketing performance across various channels and what the latest data reveals.
SEO Performance
SEO is still one of the strongest long-term, low-cost marketing channels for Shopify merchants. While it doesn’t provide immediate results like paid ads, following the right SEO checklist generates high-quality traffic with better long-term returns.
Here’s what the data shows:
- Organic search drives 13.8% of all Shopify traffic.
- Across e-commerce, organic traffic averages a 2% conversion rate, slightly higher than paid traffic for many niches.
- SEO consistently brings one of the highest ROAS because traffic is effectively free once ranked.
Email Marketing
Email marketing continues to be one of the most profitable channels for Shopify stores. Returning subscribers engage better, spend more, and respond well to automation.
Unlike cold traffic, email thrives with warm leads who already know your brand. Here’s what the numbers suggest:
- Email often delivers ROAS between 30× and 45× for e-commerce.
- CTR ranges from 2% to 3.5%, depending on the segment.
- Automated flows (abandoned cart, welcome series, post-purchase) typically drive up to 29% of total store revenue.
SMS Adoption
SMS marketing is gaining momentum as a quick, high-intent way to reach customers, especially for flash sales and last-minute reminders. While not all stores use SMS, those who do often see great returns.
Here’s what the data shows:
- SMS messages get CTR around 6–9%, far higher than email.
- Average revenue per SMS campaign keeps rising as more stores adopt text flows.
- SMS works best for repeat buyers, last-minute offers, and abandoned carts.
Google Ads Benchmarks
When it comes to intent-driven marketing, Google Ads remains one of the best channels for driving immediate, high-converting traffic to Shopify stores. Unlike social ads, Google’s search ads target customers actively looking for specific products.
Data Highlights:
- The average cost-per-click (CPC) for e-commerce ads ranges from $0.80 to $1.50.
- Search ads see CTR between 3% and 5%, which is a healthy rate for paid ads.
- The typical Cost Per Acquisition (CPA) for Shopify merchants falls between $22 and $45, depending on the niche.
- Google Shopping ads tend to produce the highest ROAS for product catalogs.
Meta Ads
Meta Ads (Facebook + Instagram) are excellent for top-of-funnel marketing and retargeting efforts. These platforms help create brand awareness through creative storytelling, making them essential for Shopify store growth.
Here’s the performance picture:
- Average CTR on Meta is 0.9% to 1.5%.
- Typical CPC ranges from $0.70 to $1.20, depending on audience quality.
- CPA can fall between $18 and $35 for well-optimized campaigns.
- User-generated content (UGC) now drives over 60% of top-performing ads on Meta.
TikTok Ads
TikTok is increasingly popular for driving impulse buys and creating viral product moments. While TikTok relies heavily on creative video content, its ability to push conversions has made it a major channel for Shopify stores.
Here’s what the data shows:
- TikTok CTR sits around 1.5% to 3% for ecommerce ads.
- CPC ranges from $0.20 to $0.60, much cheaper than Meta.
- CPAs vary widely but often fall between $15 and $25 for strong creatives.
- TikTok shops and TikTok commerce integrations push conversion even higher for creators.
Want to Scale Your Shopify Store?
Running a Shopify store isn’t always easy. From understanding marketing trends to choosing the right ad strategies and optimizing your product pages, it can feel overwhelming.
But it doesn’t have to be that hard. Brands Bro is here to help you scale your Shopify store with our team of expert developers, designers, marketers, and everything you need. We’ll help you build your dream Shopify store from scratch or scale it to meet your goals.
Shopify Market Share: United States and Global Ecommerce Comparison
Shopify powered more than 14% of U.S. ecommerce sales in 2025, increasing from over 12% in 2024. This represents purchases completed through Shopify merchants rather than Shopify’s share of ecommerce software installations.
Globally, Shopify operates in more than 175 countries and supports millions of businesses. W3Techs estimates that Shopify powers approximately 30.9% of websites using a recognized ecommerce system.
The U.S. and global figures measure different things: the U.S. statistic tracks sales value, while the global statistic tracks website technology usage. Therefore, they should not be compared directly.
Shopify B2B and Shopify Plus Sales Growth Statistics
Shopify’s B2B business continues to expand rapidly. Shopify B2B GMV reportedly increased approximately 80% year over year during Q1 2026, following 96% full-year growth in 2025.
Shopify B2B is primarily available through Shopify Plus, allowing enterprise merchants to manage wholesale and direct-to-consumer sales from one platform.
Shopify’s subscription revenue increased 21% to $750 million in Q1 2026. Growth came partly from more merchants selecting higher-priced plans such as Shopify Plus.
Shopify Payments and Shop Pay Sales Statistics
Shopify Payments processed $67.1 billion in GMV during Q1 2026, representing 67% of total Shopify GMV. Payment volume increased 41% year over year.
Shopify Payments penetration increased from 64% in Q1 2025 to 67% in Q1 2026, showing stronger merchant and customer adoption.
Shop Pay can increase conversions by up to 50% compared with guest checkout. It also provides merchants with access to more than 150 million global shoppers through the Shop ecosystem.


